Animation
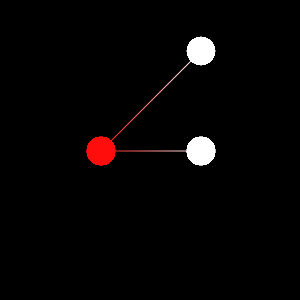
In this section we’ll see how to update the molecular viewer. We’ll start by creating a water molecule using the MolecularViewer:
import numpy as np
from chemview import MolecularViewer

# Draw a water molecule
mv = MolecularViewer(np.array([[0.0, 0.0, 0.0], [1.0, 0.0, 0.0], [0.0, 1.0, 0.0]]),
                     {'atom_types': ['H', 'O', 'H'],
                      'bonds': [[0, 1], [1, 2]]},
                     width = 300,
                     height = 300)
mv.points()
mv.lines()
mv
- then, all we need to do to move the molecule is to assign a new vector to the attribute
coordinates. To translate the molecule, we add 0.1 to the x coordinate of each atom:
new_coordinates = mv.coordinates + [0.1, 0.0, 0.0]
mv.coordinates = new_coordinates
Important
To properly update the coordinates, you have to the = (equal) sign, or the system won’t detect the update. Example:
# Good: update will be triggered
mv.coordinates = mv.coordinates + [0.1, 0.0, 0.0]

# Bad: update won't be triggered
mv.coordinates += [0.1, 0.0, 0.0]
Visualizing Trajectories/Frames
Chemview can display snapshots of systems evolving in time, using a video-player like interface. This functionality is provided by the TrajectoryViewer class.
The TrajectoryViewer widget is a combination of a MolecularViewer widget and a set of controls that automatically update the frames.
To start, we’ll see expand of the previous example. To use the TrajectoryViewer, we need a list of coordinates (one for each frame), and the topology.
We first create the initial frame start_coordinates, then we translate those coordinates by 0.1 units in the x axis for 30 times, once for each frame:
start_coordinates = np.array([[0.0, 0.0, 0.0], [1.0, 0.0, 0.0], [0.0, 1.0, 0.0]])

frames = []
for i in range(30):
    frames.append(start_coordinates + [0.1, 0.0, 0.0])
    start_coordinates += [0.1, 0.0, 0.0]
At this point, we can use the trajectory viewer to visualize the frames.
from chemview import TrajectoryViewer

tv = TrajectoryViewer(frames, {'atom_types': ['H', 'O', 'H'],
                               'bonds': [[0, 1], [1, 2]]})
tv.lines()
tv
Screenshot:
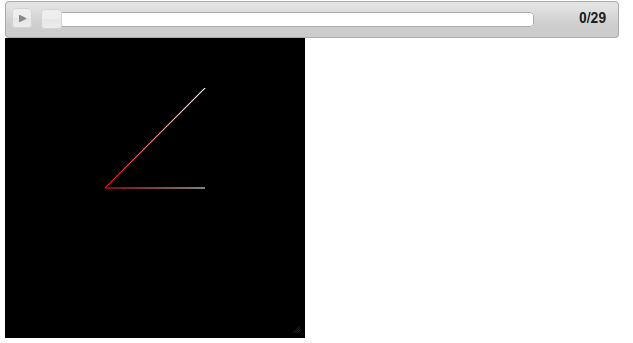
You should now have a nice bar that lets you play, pause, rewind your frames!
Using mdtraj
How do we use the trajectory viewer in practice? To show a real-world example we can get some help from the library mdtraj.
With mdtraj we can read a system and a series of snapshots generated from a simulation.
import mdtraj as md
traj = md.load_pdb('2M6K.pdb')
An mdtraj trajectory contains the coordinates for each frame in the attribute traj.xyz), plus a topology specification in traj.topology. The topology can be converted to chemview format using the utility chemview.contrib.topology_mdtraj(), that takes the trajectory as an input.
from chemview.contrib import topology_mdtraj
tv = TrajectoryViewer(traj.xyz, topology_mdtraj(traj))
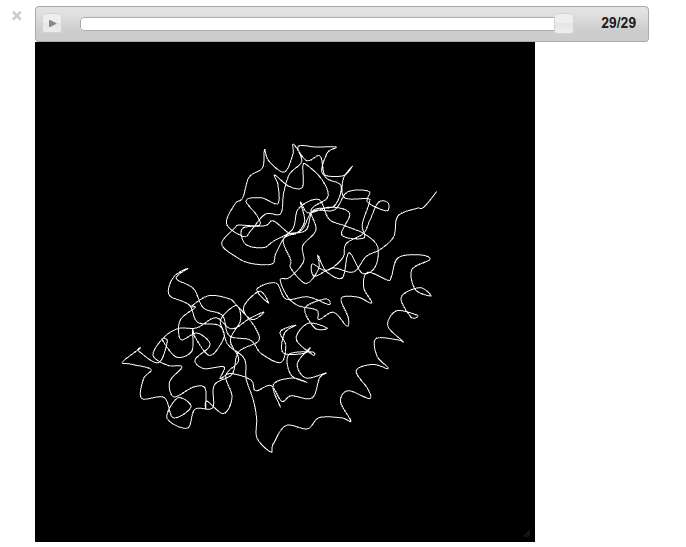
tv.line_ribbon()
tv
Screenshot:
Tip
When animating trajectories of big molecules and systems, use simple representations such as lines, points and line_ribbon because
they are much faster than their “solid” counterparts vdw, ball_and_stick and strand.